For decades, cyclists have relied on intuition and experience to guide their training. While this traditional approach has yielded impressive results, the advent of technology has revolutionized the sport. Data analytics, once a niche tool for elite athletes, is now accessible to cyclists of all levels.
By harnessing the power of data, cyclists can gain invaluable insights into their performance, optimize their training, and achieve their goals more efficiently.
Key Metrics to Track

Data analytics offers cyclists a powerful tool to unlock their potential. By tracking key metrics and analyzing performance data, cyclists can gain valuable insights into their training and make informed decisions.
Power Output:
Power is measured in watts (W). A higher wattage indicates a greater amount of work being done. By tracking power output, cyclists can gain valuable insights into their performance, such as:
- Identifying strengths and weaknesses: Analyzing power output data can help cyclists identify areas where they excel and areas that need improvement.
- Optimizing training intensity: Power meters allow cyclists to train with specific power targets, ensuring they’re working at the right intensity to achieve their goals.
- Monitoring fatigue and recovery: By tracking power output, cyclists can assess their recovery status and adjust their training load accordingly.
- Improving efficiency: By analyzing power output data, cyclists can identify inefficiencies in their pedaling technique and make adjustments to improve their overall performance.
By understanding and utilizing power output data, cyclists can unlock their full potential and take their training to the next level.
Heart Rate:
Heart rate is the number of times your heart beats per minute (bpm). It’s a fundamental measure of your cardiovascular health and physical exertion.
Why is heart rate important for cyclists?
- Monitoring Intensity: Heart rate helps you gauge the intensity of your workout. By tracking your heart rate during different activities, you can adjust your effort to achieve optimal training zones.
- Assessing Fitness: A lower resting heart rate often indicates improved cardiovascular fitness. By monitoring your resting heart rate, you can track your progress over time.
- Recovery Monitoring: Your heart rate can provide insights into your recovery status. By tracking your recovery heart rate, you can determine when it’s safe to resume training.
By understanding and monitoring your heart rate, you can optimize your training, reduce the risk of injury, and improve your overall cycling performance
Cadence:
Cadence is the rate at which a cyclist pedals, measured in revolutions per minute (RPM). It’s essentially the speed at which you turn the pedals.
A higher cadence generally leads to:
- Smoother pedaling: A higher cadence can help you maintain a smooth and efficient pedaling stroke.
- Reduced muscle fatigue: A higher cadence can distribute the workload across more muscle fibers, reducing fatigue.
- Improved power output: By increasing your cadence, you can generate more power, especially in lower gears.
However, it’s important to find a cadence that works best for you and the specific riding conditions. A good cadence for most cyclists is between 80 and 90 RPM.
Speed and distance
Speed and distance are fundamental metrics in cycling, providing insights into performance and progress.
- Speed: This measures how quickly a cyclist covers a certain distance. It’s influenced by factors like terrain, wind conditions, and the cyclist’s fitness level. Tracking speed helps cyclists assess their performance and identify areas for improvement.
- Distance: This refers to the total length of a ride. Tracking distance helps cyclists monitor their training volume and set achievable goals.
By analyzing speed and distance data, cyclists can:
- Track Progress: Monitor improvements over time.
Set Goals: Establish specific targets for distance and speed. - Analyze Performance: Identify strengths and weaknesses in different riding conditions.
- Plan Training: Design effective training plans based on distance and intensity.
By understanding these metrics and how they relate to other factors like power output and heart rate, cyclists can make informed decisions to optimize their training and achieve their goals.
Understanding Your Body
Identifying Strengths and Weaknesses
By analyzing your power output data, you can gain valuable insights into your strengths and weaknesses as a cyclist. For example, you might discover that you excel at sustained efforts but struggle with explosive power. This information can help you tailor your training to target specific areas for improvement.
Here are some specific ways to use data to identify your strengths and weaknesses:
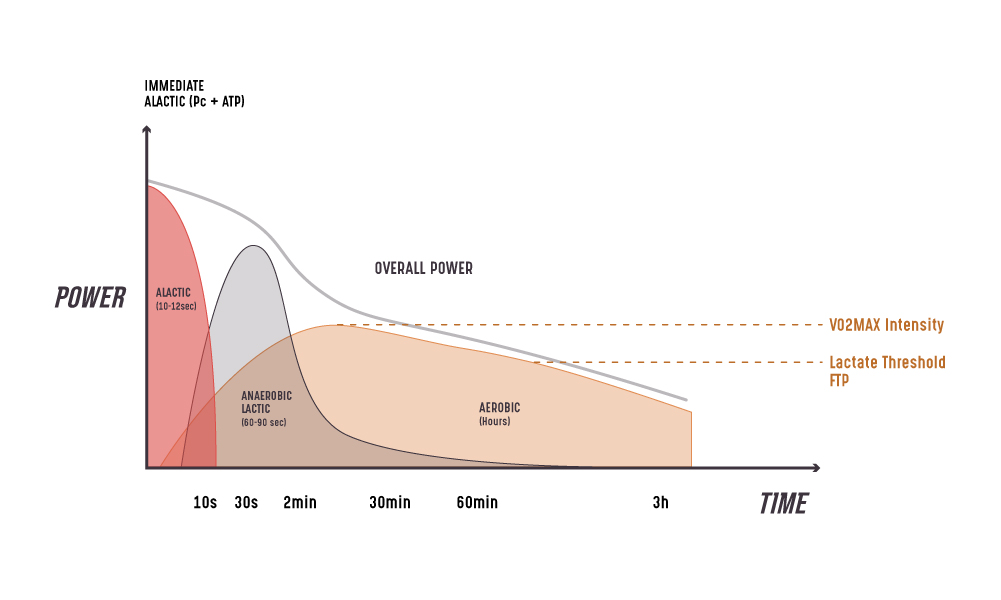
- Power Curve Analysis: By examining your power curve (Figure below), you can identify your strengths in different power domains, such as sprint power, sustained power, and endurance. Your power curve is a graphical representation of your maximum sustained power output over different time intervals. It typically shows a downward-sloping curve, as your power output decreases over longer durations.
- Critical Power (CP) and Functional Threshold Power (FTP): These metrics provide insights into your sustained power output. By tracking changes in your CP and FTP, you can assess your overall fitness and training progress. Related: 4 Types of Training to Improve your FTP
- Pedaling Smoothness: Analyzing your pedaling smoothness can help you identify inefficiencies in your technique, such as excessive lateral movement or inconsistent cadence.
By understanding your strengths and weaknesses, you can create a targeted training plan that maximizes your potential and helps you achieve your cycling goals.
Monitoring Fatigue and Recovery:
To optimize your training and prevent overtraining, it’s crucial to monitor your body’s recovery status. Data analytics can provide valuable insights into your recovery levels, allowing you to make informed decisions about your training schedule.
Key Metrics for Monitoring Recovery:
- Heart Rate Variability (HRV): HRV measures the variation in the time intervals between heartbeats. Lower HRV often indicates increased stress and fatigue, while higher HRV suggests better recovery.
- Power Output: Tracking changes in power output can provide clues about your recovery status. A decrease in power output may signal fatigue, while a consistent or increasing trend suggests adequate recovery.
- Subjective Ratings of Perceived Exertion (RPE): Self-reported measures of perceived exertion can provide valuable information about your recovery status. By rating the difficulty of your workouts, you can identify periods of high stress and adjust your training accordingly.
Strategies for Effective Recovery:
- Active Recovery: Light activities like easy cycling or yoga can help flush out metabolic waste and improve blood flow.
- Adequate Sleep: Prioritize quality sleep to allow your body to repair and recover.
- Proper Nutrition: Consume a balanced diet rich in carbohydrates, protein, and healthy fats to fuel your body and support recovery (read more about Proper Nutrition for Cycling here).
- Hydration: Stay hydrated to optimize performance and recovery.
- Stress Management: Practice stress-reduction techniques like meditation or yoga to promote relaxation and recovery.
By combining data-driven insights with effective recovery strategies, you can optimize your training and achieve your cycling goals.

Optimizing Training Intensity
Data-driven insights empower cyclists to tailor their training intensity to maximize performance and minimize the risk of injury. By analyzing key metrics such as power output, heart rate, and perceived exertion, cyclists can identify their optimal training zones and structure their workouts accordingly.
Key Training Zones:
- Active Recovery (Zone 1):
- Low-intensity, steady-state effort at approximately 50-60% of FTP.
- Improves basic aerobic fitness, aids in recovery, and reduces muscle soreness.
- Endurance (Zone 2):
- Steady-state, moderate-intensity effort at approximately 60-75% of FTP.
- Builds aerobic capacity, improves mitochondrial density, and increases fat-burning capacity.
- Tempo (Zone 3):
- Sustained, steady effort at a challenging intensity, around 75-85% of FTP.
- Improves lactate threshold, increases power output, and enhances endurance.
- Lactate Threshold (Zone 4):
- High-intensity effort, pushing the limits of sustained aerobic power, around 85-90% of FTP.
- Improves lactate threshold, power output, and mental toughness.
- VO2 Max (Zone 5):
- Maximal effort, pushing the limits of oxygen uptake, above 90% of FTP.
- Improves aerobic capacity, peak power output, and mental toughness.
- Anaerobic Capacity (Zone 6):
- Very high-intensity, short-duration efforts, often above 105% of FTP.
- Improves explosive power, speed, and neuromuscular efficiency.
- Neuromuscular Power (Zone 7):
- Extremely high-intensity, short bursts of effort, often above 120% of FTP.
- Improves explosive power, speed, and reaction time.
By understanding these training zones and using data to guide their training, cyclists can optimize their workouts, reduce the risk of injury, and achieve their cycling goals.
Personalizing Your Training
Tailored Workouts
Data analysis allows you to create personalized training plans that align with your specific goals and fitness level. By understanding your strengths, weaknesses, and recovery patterns, you can tailor your workouts to maximize your potential.
Here are some examples of how data-driven training can help you create personalized workouts:
- Goal-Specific Training: Whether you’re training for a century ride, a triathlon, or a local criterium, data analysis can help you identify the specific training zones and workouts that will help you achieve your goals.
- Adaptive Training: By tracking your performance metrics, you can adjust your training plan as needed. For example, if you’re feeling fatigued, you can reduce the intensity or volume of your workouts.
- Injury Prevention: Data-driven training can help you identify potential injury risks, such as overtraining or muscle imbalances. By monitoring your training load and recovery, you can adjust your workouts to minimize the risk of injury.
By taking a data-driven approach to training, you can optimize your workouts, reduce the risk of injury, and achieve your cycling goals more efficiently.
Adapting to Changing Conditions
By monitoring key metrics, you can adjust your training to account for factors like weather, altitude, and course conditions. For example, if you’re training at a higher altitude, you might need to adjust your training intensity to account for the reduced oxygen levels.
Here are some specific examples of how data-driven training can help you adapt to changing conditions:
- Weather: If you’re training in hot and humid conditions, you may need to reduce your training intensity and increase your fluid intake. By tracking your heart rate and power output, you can monitor your effort level and make adjustments as needed.
- Altitude: Training at altitude can improve your aerobic capacity. However, it’s important to adjust your training intensity to account for the reduced oxygen availability. By tracking your heart rate and power output, you can determine the appropriate training intensity for your altitude.
- Course Conditions: Whether you’re training on rolling hills, flat roads, or mountainous terrain, data-driven insights can help you optimize your training. By analyzing your performance data from different types of rides, you can identify your strengths and weaknesses and tailor your training accordingly.
By being adaptable and making data-driven adjustments to your training, you can maximize your performance and achieve your cycling goals.
Setting and Achieving Realistic Goals
Data-driven insights empower you to set realistic and achievable goals. By analyzing your performance data, you can identify areas for improvement and set Specific, Measurable, Achievable, Relevant, and Time-bound (SMART) goals.
Here’s how data can help you set and achieve your goals:
- Baseline Assessment: Use your initial data to establish a baseline for your fitness level.
- Progress Tracking: Monitor your progress over time to stay motivated and make adjustments as needed.
- Goal Setting: Set specific, measurable goals, such as increasing your average power output or completing a certain distance within a specific time frame.
- Adapting Goals: Be flexible and willing to adjust your goals as your fitness level changes.
By using data to inform your goal-setting process, you can stay motivated, track your progress, and celebrate your achievements.
The Role of Technology
in Data-Driven Cycling
Technology has revolutionized the way cyclists train and compete. By leveraging various technological tools, cyclists can gain valuable insights into their performance, optimize their training, and achieve their goals.
Cycling Computers and GPS Devices
Cycling computers and GPS devices are essential tools for tracking key metrics such as:
- Distance: Measures the total distance traveled during a ride.
Speed: Tracks the average and maximum speed achieved during a ride. - Elevation: Records changes in elevation, including climbs and descents.
- Time: Tracks the duration of a ride.
These devices also allow cyclists to create detailed ride profiles, which can be used to analyze performance, identify areas for improvement, and plan future training sessions.
In the next sections, we’ll delve deeper into other technologies that empower data-driven cycling, including power meters, heart rate monitors, and specialized cycling apps.
Power Meters
Power meters are one of the most powerful tools for cyclists to analyze their performance and optimize their training. By measuring the mechanical power output in watts, power meters provide precise insights into a cyclist’s effort.
Key Benefits of Power Meters:
- Quantifying Effort: Power meters allow cyclists to measure their exact power output, providing a more accurate measure of effort compared to heart rate or perceived exertion.
- Optimizing Training Zones: By analyzing power output data, cyclists can identify their functional threshold power (FTP) and other key power zones. This information can be used to structure training plans that target specific physiological adaptations.
- Improving Efficiency: Power meters can help cyclists identify inefficiencies in their pedaling technique and make adjustments to improve their power output.
- Tracking Progress: By tracking power output over time, cyclists can monitor their progress and set realistic goals.
By incorporating power meter data into their training, cyclists can achieve significant improvements in their performance.
Heart Rate Monitors
Heart rate monitors are essential tools for cyclists to track their cardiovascular health and optimize their training intensity. By measuring heart rate, cyclists can gauge their effort level, monitor recovery, and prevent overtraining.
Key Benefits of Heart Rate Monitors:
- Monitoring Heart Rate Zones: By tracking heart rate, cyclists can identify specific heart rate zones that correspond to different training intensities (e.g., aerobic, anaerobic threshold, VO2 max).
- Assessing Fitness Level: Changes in resting heart rate can indicate improvements in cardiovascular fitness. A lower resting heart rate often signifies better heart health.
- Monitoring Recovery: Heart rate variability (HRV) can provide insights into recovery status. Higher HRV indicates better recovery, while lower HRV may suggest overtraining.
- Customizing Training Plans: By analyzing heart rate data, cyclists can tailor their training plans to their individual needs and goals.
By utilizing heart rate monitors, cyclists can effectively monitor their cardiovascular health, optimize their training, and reduce the risk of overtraining.
Specialized Cycling Apps
Specialized cycling apps have revolutionized the way cyclists train and analyze their performance. These apps offer a wide range of features, including:
- Data Analysis: Cycling apps can analyze data from various sources, such as power meters, heart rate monitors, and GPS devices, to provide detailed insights into your performance. You can track metrics like power output, cadence, heart rate, and speed to identify strengths, weaknesses, and areas for improvement.
- Training Plan Creation: Many cycling apps offer customizable training plans tailored to your specific goals and fitness level. You can choose from a variety of pre-designed plans or create your own custom workouts.
- Social Features: Connect with other cyclists, join virtual challenges, and share your ride data. Social features can help you stay motivated, find training partners, and learn from other cyclists.
- Route Planning: Plan your rides using built-in mapping tools and GPS navigation. You can create custom routes, explore new areas, and track your progress.
- Virtual Cycling: Many apps offer virtual cycling platforms that allow you to train indoors and compete against other cyclists from around the world.
By leveraging the power of cycling apps, cyclists can take their training to the next level and achieve their goals.

Darefore: Your Data-Driven Cycling Companion
Darefore is a revolutionary device that empowers cyclists to take their training to the next level. By providing real-time feedback and comprehensive data analysis, Darefore helps you optimize your performance and achieve your cycling goals.
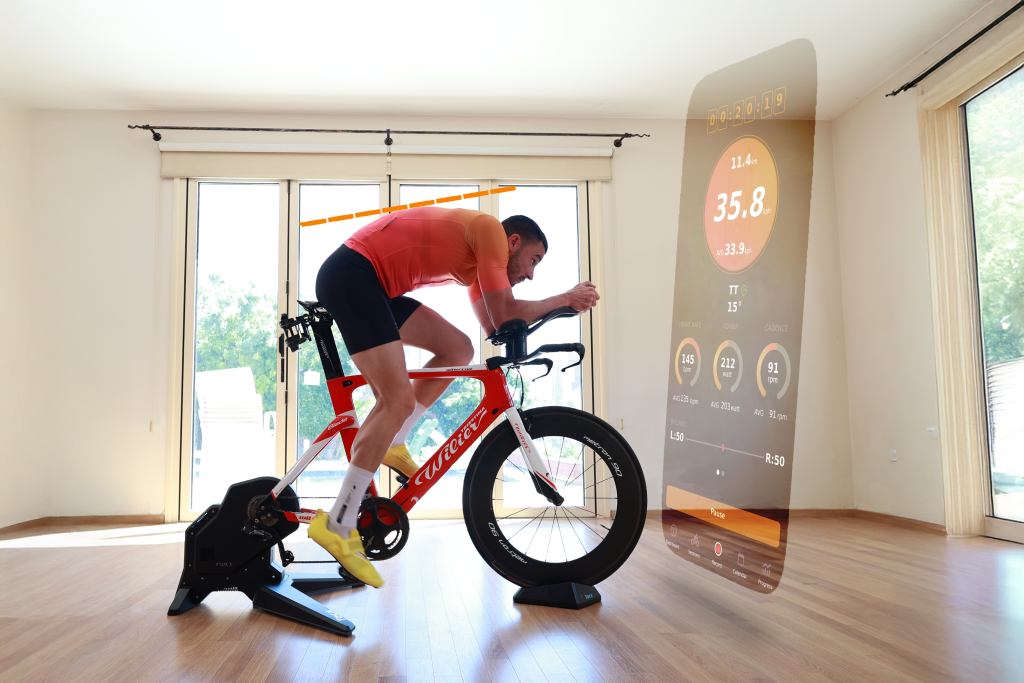
Real-time Feedback
Darefore’s real-time feedback feature provides instant insights into your cycling position and power output. By analyzing your body position, you can identify inefficiencies and make adjustments to improve your aerodynamics and reduce drag.
Key benefits of real-time feedback
Improved Aerodynamics:
- By tracking your back angle, Darefore can help you maintain a more aerodynamic position, reducing drag and improving your overall efficiency.
- A more aerodynamic position can help you conserve energy, especially during long rides or races, allowing you to maintain a higher speed with less effort.
- Additionally, a more aerodynamic position can help you feel more comfortable and less fatigued, improving your overall riding experience.
Optimized Power Output:
- Real-time feedback can help you find the perfect balance between aerodynamics and power output, allowing you to maximize your performance.
- By analyzing your pedaling technique and body position, Darefore can help you identify areas where you can improve your power output and efficiency. For example, if you’re leaning too far forward, you may be sacrificing power for aerodynamics.
- By making small adjustments to your position, you can improve your power output without compromising your aerodynamics.
Improved Comfort and Performance:
- By maintaining a proper back angle, you can reduce strain on your back and neck, improving your comfort during long rides.
- Additionally, a good back angle can help you breathe more efficiently, reducing fatigue and improving your overall performance.
- A comfortable and efficient riding position can also help you maintain focus and reduce the risk of accidents.
By incorporating real-time feedback into your training, you can refine your technique, elevate your performance, and enjoy a more comfortable and efficient ride. Darefore’s real-time feedback can help you identify and correct poor habits, optimize your power output, and improve your overall cycling economy. Whether you’re a seasoned cyclist or just starting out, Darefore can help you reach your full potential.
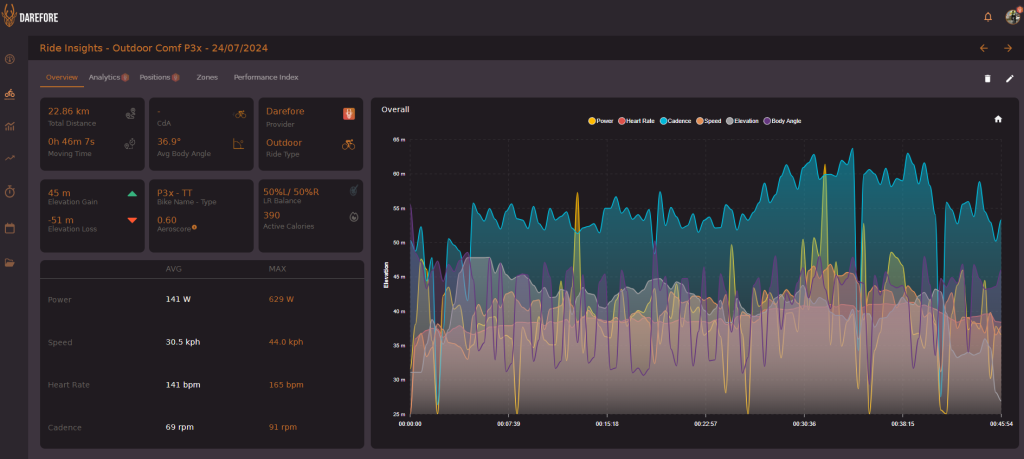
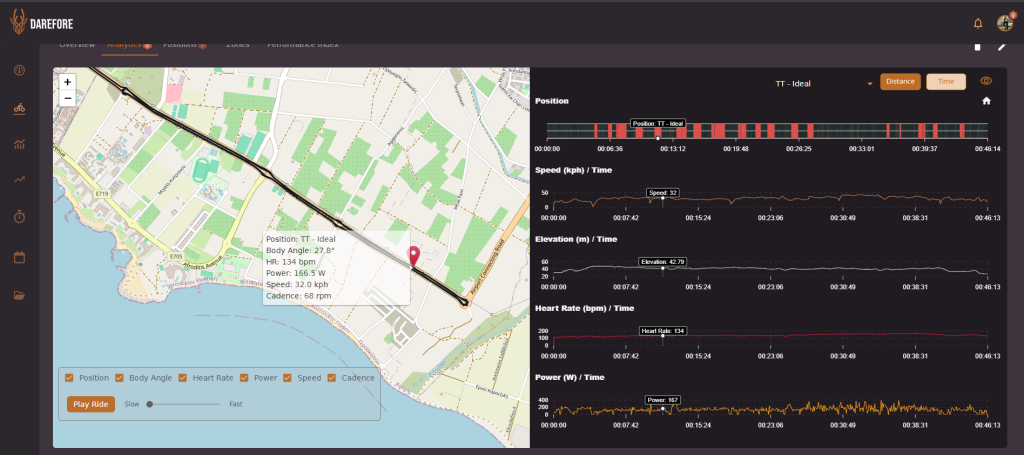
Comprehensive Data Analytics
Darefore’s comprehensive data analytics platform provides you with a wealth of information to optimize your training. By analyzing your ride data, you can gain valuable insights into your performance and make data-driven decisions.
Key Data Insights:
- Power Analysis:
- Visualize your power output over different time intervals to identify your strengths and weaknesses.
- Correlate your power output with your body position to identify optimal positions for different power outputs.
- Heart Rate Zones:
- Analyze your heart rate data to monitor your training intensity and recovery.
- Correlate your heart rate with your power output and body position to identify optimal training zones and identify inefficient pedaling techniques.
TIP: If your heart rate is elevated while your power output is low, it may indicate that you are not using your muscles efficiently. By making adjustments to your body position and pedaling technique, you can improve your efficiency and reduce your heart rate at a given power output.
- Cadence Balance:
- Assess the balance between your left and right leg pedaling cadence to identify potential imbalances that may be affecting your performance and causing discomfort.
- A well-balanced pedaling stroke can improve efficiency and reduce the risk of injury.
- Elevation Profile:
- Visualize your elevation gain and loss to assess the intensity of your ride.
- Correlate the elevation profile with your power output, heart rate, and body position to identify patterns and trends in your performance.
TIP: You might notice that your power output decreases on steep climbs, or that your heart rate increases more rapidly than your power output (Decoupling). By analyzing these patterns, you can identify areas for improvement, such as improving your climbing technique or increasing your aerobic capacity.
- Route Maps: Review your ride routes to identify areas for future training or exploration. See your position change on the map and analyze your performance in different terrains and conditions.
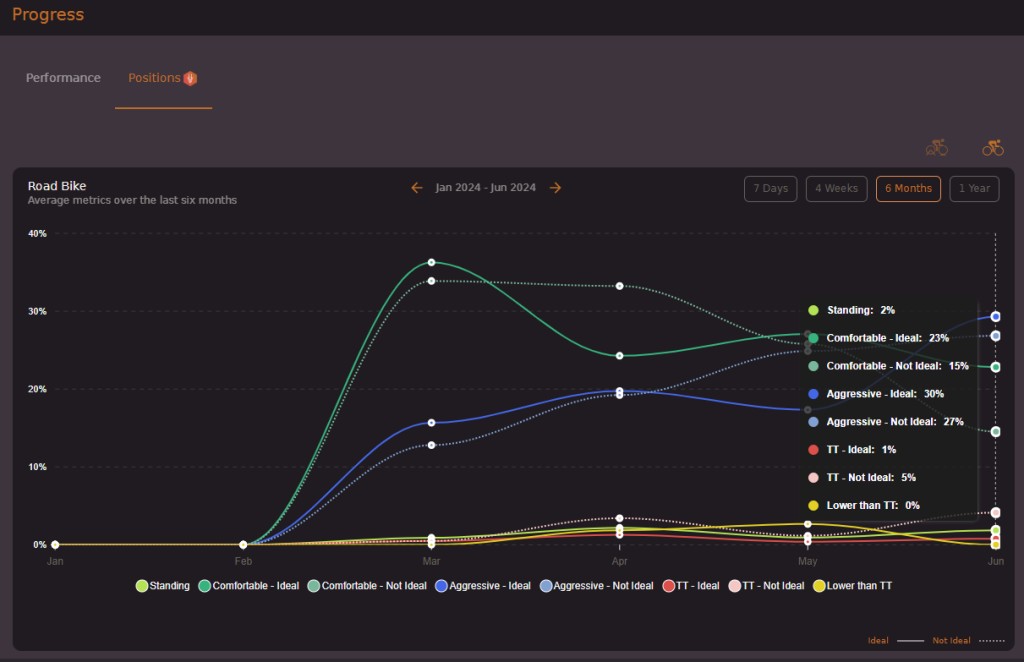
Identifying Trends and Patterns:
By analyzing your historical data, you can identify trends and patterns in your performance. For example, you might notice that your power output is declining on long rides or that your heart rate is consistently higher during certain types of workouts. By understanding these trends, you can make adjustments to your training plan to improve your performance.
Additionally, Darefore’s data analytics platform can help you identify potential areas for improvement, such as optimizing your bike fit, refining your pedaling technique, or improving your nutrition and hydration strategies. By using data to inform your decisions, you can take a more scientific and effective approach to your cycling training.
Personalized Training Plans
Darefore’s data-driven insights enable you to create personalized training plans that align with your specific goals and fitness level. By analyzing your performance data, you can tailor your workouts to maximize your potential and minimize the risk of injury.
Key Features:
- Custom Workout Builder: Create custom workouts with specific power, heart rate, and cadence targets. You can also incorporate position-specific targets to improve your aerodynamics and efficiency. For example, you can create a workout that includes intervals of high-intensity efforts in an aerodynamic position followed by recovery periods in a more upright position.
- Coach Integration: Connect with a cycling coach to receive personalized training advice. Your coach can analyze your data and provide specific recommendations to help you achieve your goals. They can also prescribe workouts with specific position targets to address your individual needs.
By leveraging Darefore’s personalized training features, you can optimize your training, accelerate your progress, and achieve your cycling goals
The Future of Cycling: Data-Driven Performance
Data-driven cycling has revolutionized the way we train and compete. By leveraging technology and data analytics, cyclists can gain valuable insights into their performance, optimize their training, and achieve their goals.
Darefore empowers cyclists to unlock their full potential by providing real-time feedback and comprehensive data analysis. With Darefore, you can:
- Optimize Your Position: Improve your aerodynamics and efficiency by analyzing your body position and making necessary adjustments.
- Maximize Your Power Output: Uncover hidden power reserves by optimizing your pedaling technique and power delivery.
Personalize Your Training: Create tailored training plans that align with your specific goals and fitness level. - Track Your Progress: Monitor your performance metrics over time to track your progress and identify areas for improvement.
By embracing technology and data-driven training, you can take your cycling to new heights. Try Darefore today and experience the future of cycling.