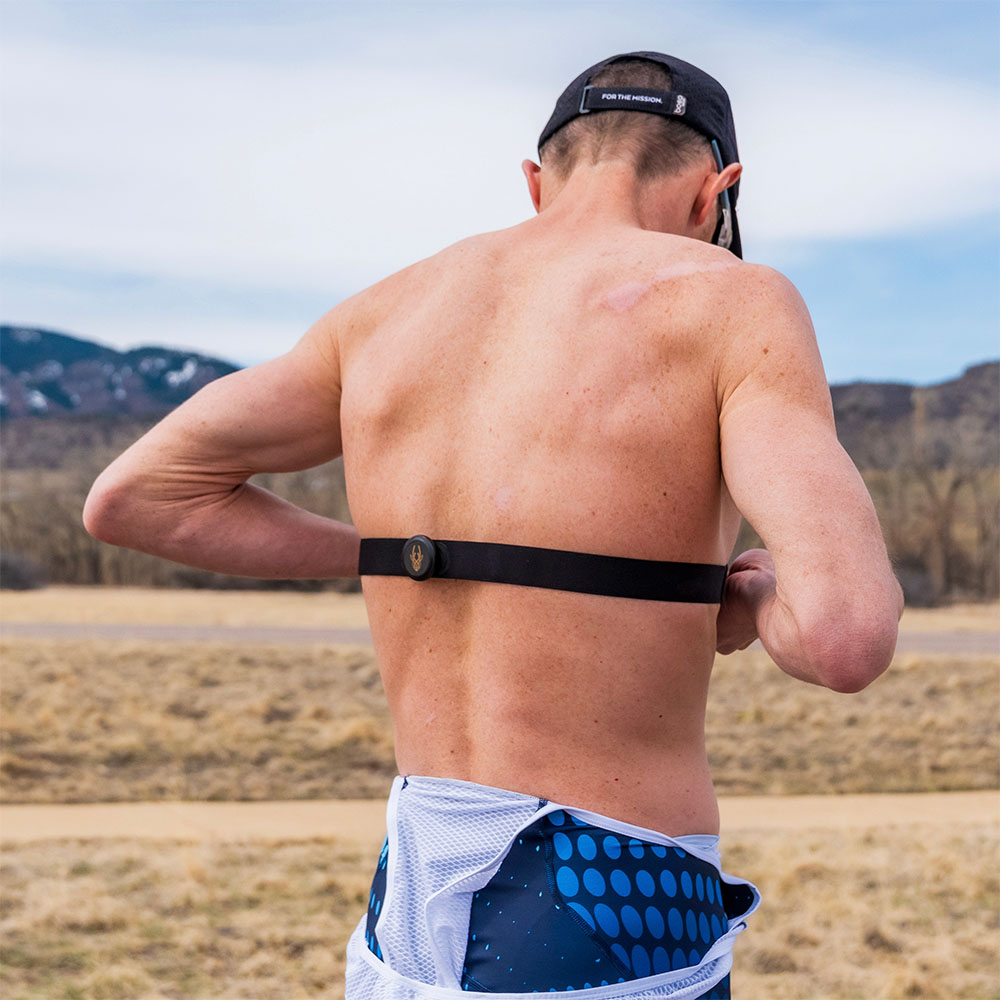
Record your rides with GPS and the Darefore sensor
View live posture data, torso angle, and CdA
Get realistic virtual speed for indoor sessions
Auto-syncs to Darefore Hub
Get your AeroScore after every ride
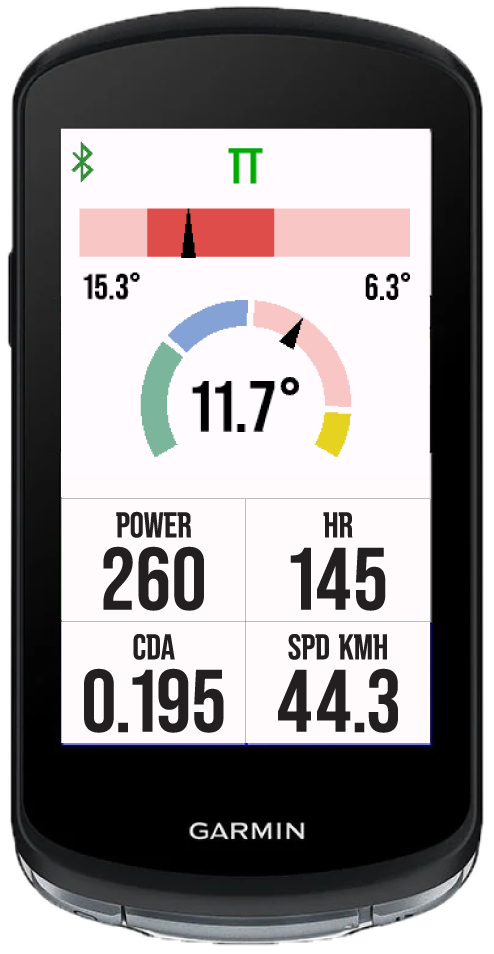
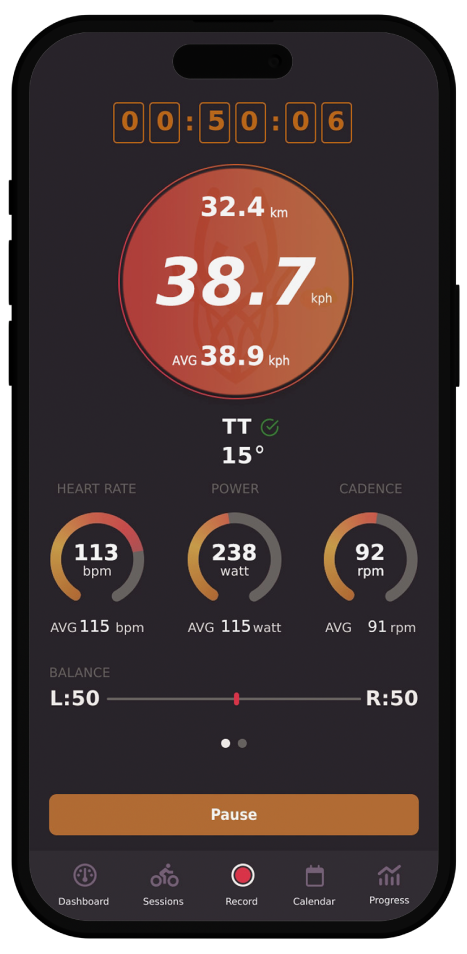
View torso angle in degrees
See estimated position and accuracy
Monitor live CdA, heart rate, and power
Track speed / virtual speed and distance
Customizable display Garmin Edge or compatible watch.
Record your rides with GPS and the Darefore sensor
View live posture data, torso angle, and CdA
Get realistic virtual speed for indoor sessions
Auto-syncs to Darefore Hub
Get your AeroScore after every ride
See estimated position and accuracy
Monitor live CdA, heart rate, and power
Track speed / virtual speed and distance
View torso angle in degrees
Customizable display Garmin Edge or compatible watch.
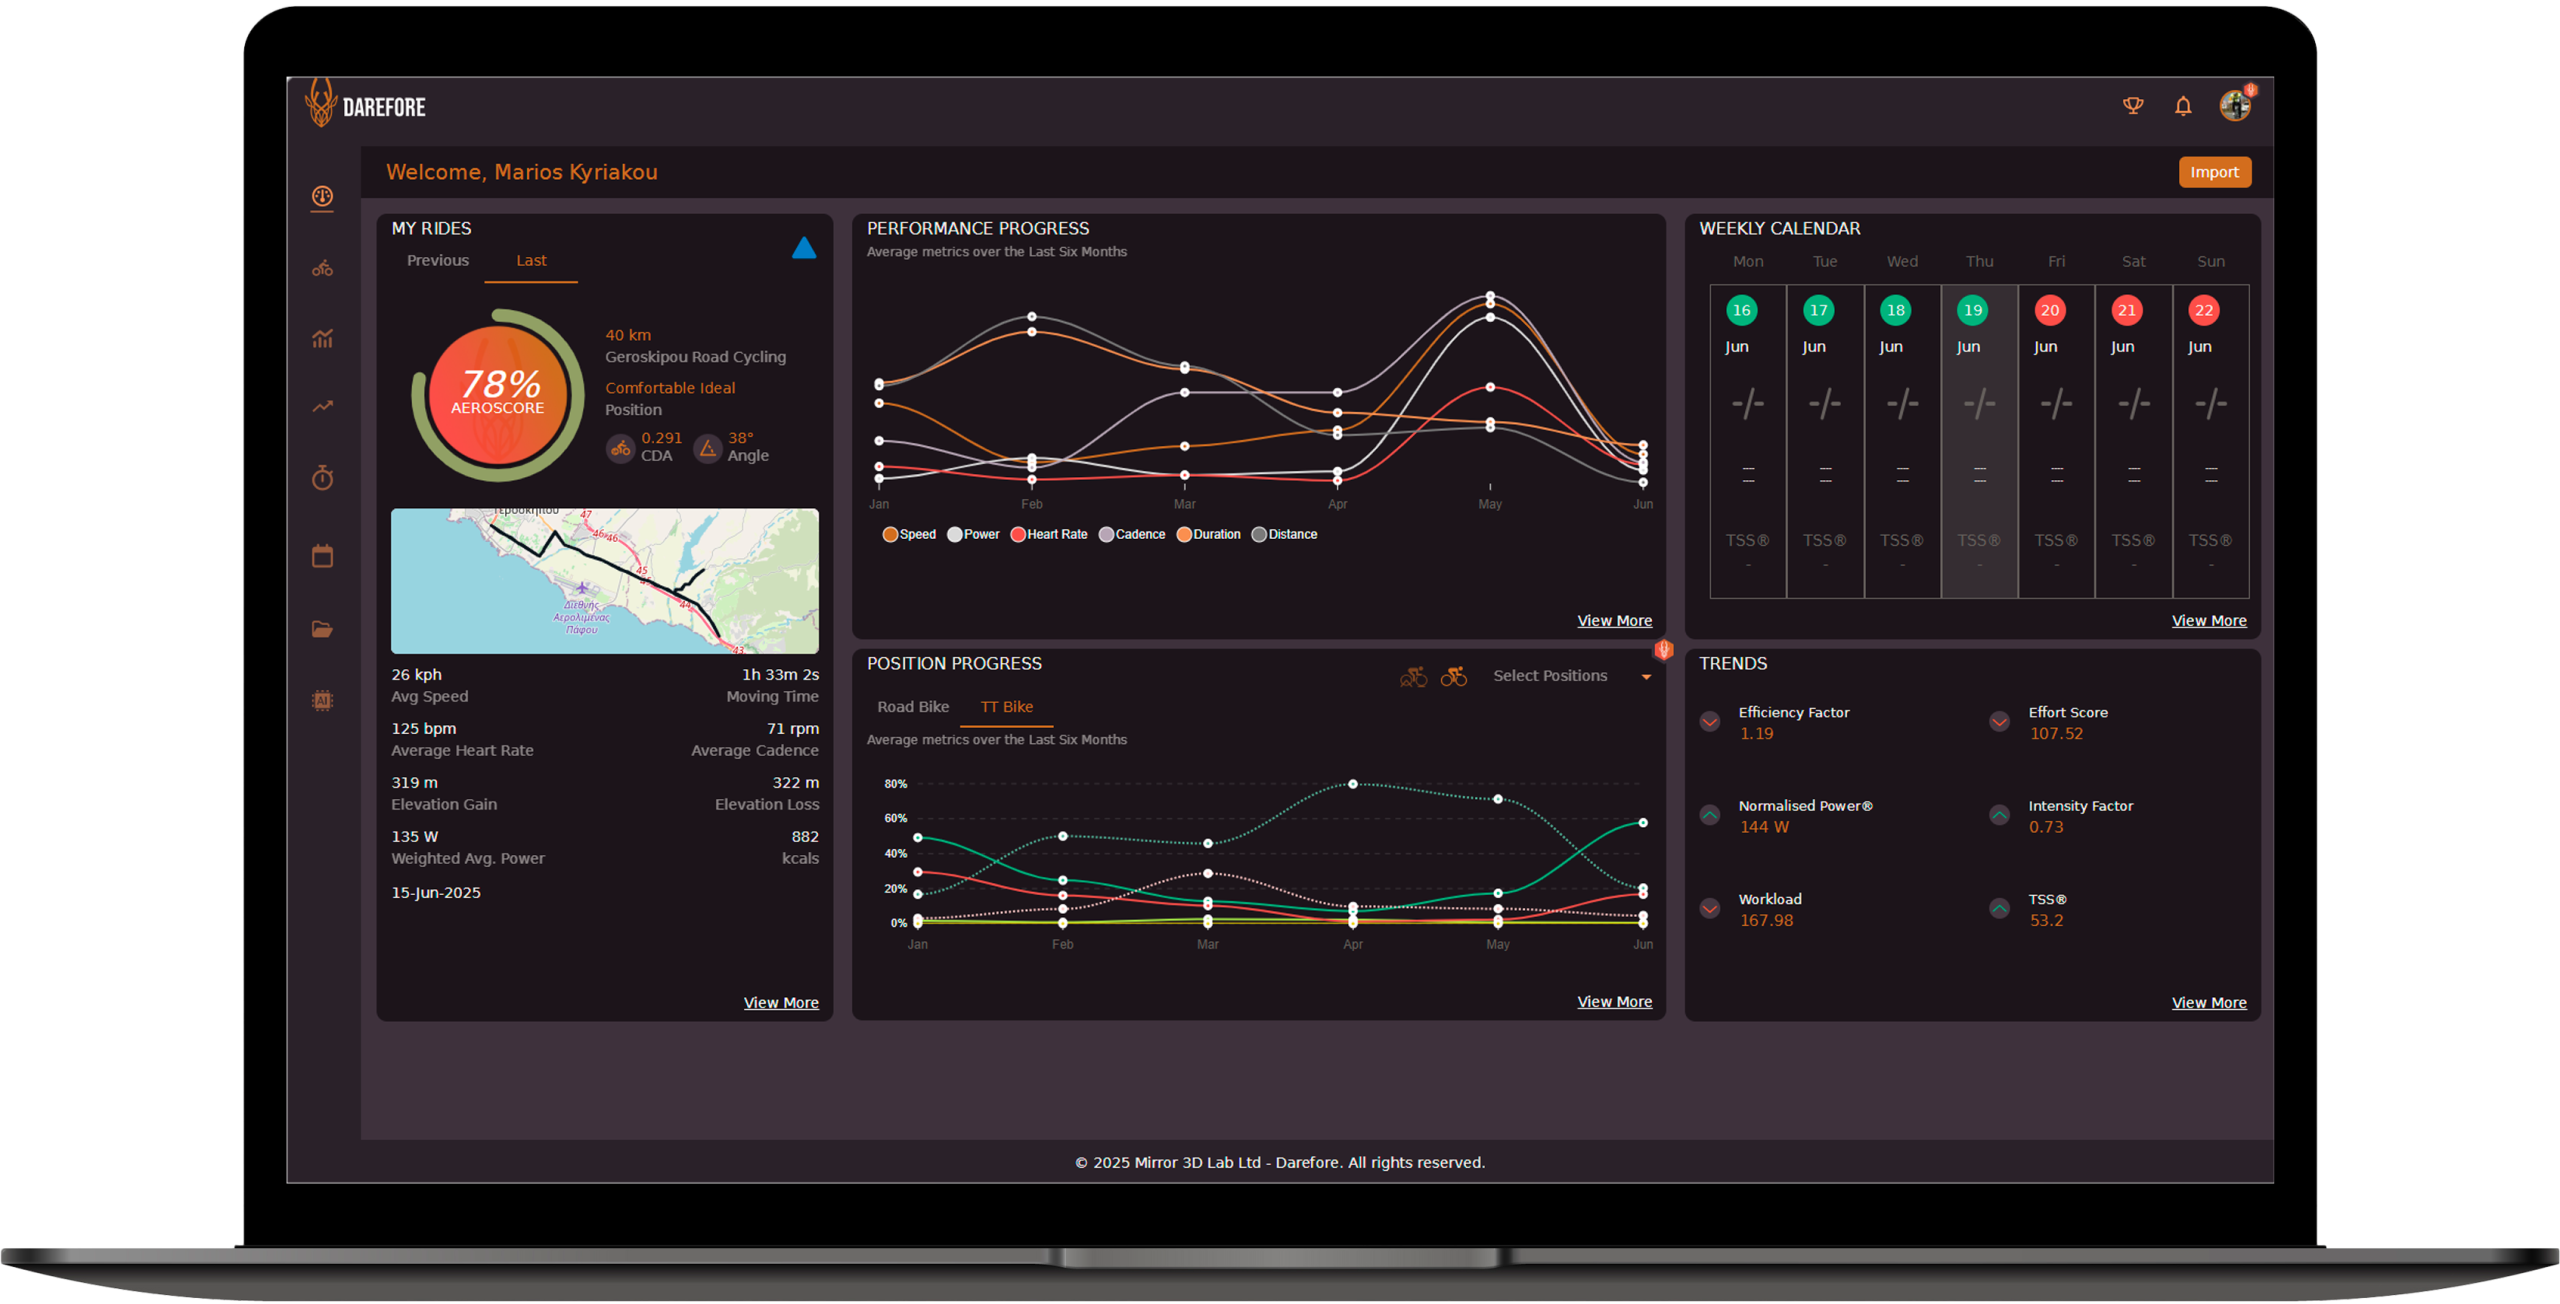
My Rides
Your ride at a glance — with posture and aero context.
This block includes:
- AeroScore – A summary of your aerodynamic performance
- CdA – Estimated aerodynamic drag (coefficient of drag × area)
- Torso Angle – Average body angle for the session
- Ride Map – Route preview with position + data overlay
- Position Type – Detected position (e.g. Comfortable, Aggressive)
Why it matters:
Your AeroScore and posture metrics tell you not just what you did — but how efficiently you rode. It’s instant feedback on your form and aero quality.
Performance Progress
Track how you’re progressing over time.
This block includes:
- Speed
- Power
- Heart Rate
- Cadence
- Duration
- Distance
Why it matters:
Visualizing your performance trends month over month helps you see gains, plateaus, or fatigue. Darefore connects these metrics to posture data for a deeper view of what’s driving progress.
Position Progress
See how well you maintain optimal form.
This block includes:
- Road Bike / TT Bike toggle
- Time spent in Ideal vs Non-Ideal range
- Consistency of torso angle per position type
Why it matters:
Small posture improvements can lead to big drag reductions. This block helps you fine-tune your body position and stay more aerodynamic longer.
Weekly Calendar
See your training plan and what’s been completed.
This block includes:
- Completed sessions (green)
- Missed workouts (red)
- Upcoming workouts (blue)
- Total load by day (TSS®)
Why it matters:
Quickly spot training gaps or overshoots. Helps you stay on track, manage fatigue, and align with your long-term goals.
Trends (Performance Index)
Understand the cost and quality of your effort.
This block includes:
- Efficiency Factor (EF) – Power relative to heart rate
- Normalized Power (NP) – Effort adjusted for variability
- Intensity Factor (IF) – Effort compared to your threshold
- Training Stress Score (TSS®) – Total physiological load
- Workload – Composite metric of training demand
Why it matters:
These aren’t just numbers — they tell you how your body handled the ride. Darefore uses them to go beyond speed and distance, helping you manage fatigue, pace smarter, and track aerobic efficiency over time.
Sessions
All your rides in one place — searchable, sortable, and comparable.
This block includes:
- Ride name, date, and distance
- Avg speed & power
- Provider (Garmin, Darefore, Strava, Manual)
- Bike used & detected positions
- Fit file import, delete, and compare tools
Why it matters:
Every session is stored here so you can revisit details, compare efforts, and track your consistency over time — all with flexible filters.
Progress
Visualize how your performance has evolved.
This block includes:
- Speed
- Power
- Heart Rate
- Cadence
- Distance
- Duration
Why it matters:
See long-term trends in your training. Are you getting stronger? More efficient? Use this to measure the real impact of your effort and positioning habits.
Trends
Understand the cost and quality of your effort.
This block includes:
- Efficiency Factor (EF) – Power per heart rate
- Normalized Power (NP) – Adjusted power
- Intensity Factor (IF) – Power vs. FTP
- TSS® – Total training load
- Workload – Cumulative effort
- Speed Efficiency – Speed vs. power
- Ideal Positions – % time in ideal form
- Variability Index – How steady was your effort?
Why it matters:
These numbers explain how your body responded to training — not just what you did. Use them to avoid overtraining, track adaptations, and optimize for aero and endurance.
Personal Records
Your lifetime highs — for both power and posture.
This block includes:
- Max Speed
- Max Avg Speed
- Max Power (instant and avg)
- Max Heart Rate & Cadence
- Max Elevation, Distance, and Duration
- Ideal Position % across TT and Road
Why it matters:
Track your personal bests and use them as benchmarks for future goals. See how aerodynamic gains improve real-world performance.
Calendar
Your month at a glance — planned, completed, and missed.\
This block includes:
- Color-coded workouts: green (done), red (skipped), blue (to-do)
- Daily ride summaries: distance, time, TSS®
- Monthly totals
Why it matters:
You can't improve what you don’t track. The calendar helps you stay on schedule, adjust for fatigue, and keep long-term training goals visible.
Library
Manage your training plans and workouts.
This block includes:
- My Plans: active, completed, scheduled
- Plan details: duration, workout volume, type
- Indoor/outdoor support
Why it matters:
Choose a structure that fits your goals. Your training plan lives here — designed to match your ability and build consistency.
Darefore AI
Your smart coach — optimizing performance and preventing injury.
This block includes:
- Ideal Body Angle suggestions based on goals (Power, Aero, Comfort, etc.)
- Position Stability tracking (±deg) across sessions
- Cadence Optimization — ideal vs actual
- Avg Power / Speed analysis by angle
- Left/Right Imbalance detection
- Posture & Fatigue Alerts
- Heart Rate & Power Drift indicators
- Training Load & Intensity Monitoring
- AI Coach Tips personalized to your recent rides
Why it matters:
Darefore AI helps you ride smarter — not just harder. It detects inefficiencies, imbalances, and fatigue patterns before they impact your performance or lead to injury. Whether you're chasing watts or recovery, this is your intelligent feedback loop.
My Rides
Your ride at a glance — with posture and aero context.
Performance Progress
Track how you’re progressing over time.
Position Progress
See how well you maintain optimal form.
Weekly Calendar
See your training plan and what’s been completed.
Trends (Performance Index)
Understand the cost and quality of your effort.
Tap the icons to explore:
- Dashboard – Overview
- Sessions – All your rides
- Progress – Performance over time
- Trends – Effort vs. outcome
- Records – Your best moments
- Calendar – Monthly view
- Library – Plans & workouts
- AI Coach – Smart training help